SG Macro Compass Index
A next-generation global index designed to provide stable and consistent returns through up, down and sideways economies
The economy will always go up, down or sideways
From the Roaring ’20s to the Great Depression, from the boom of the 1990s to the Financial Crisis of 2009, the economy has historically moved in cycles. While the future is unpredictable, we know that the economy will go up, down or sideways through the phases of the economic cycle shown below.
Helpful resources
Phases of the economic cycle
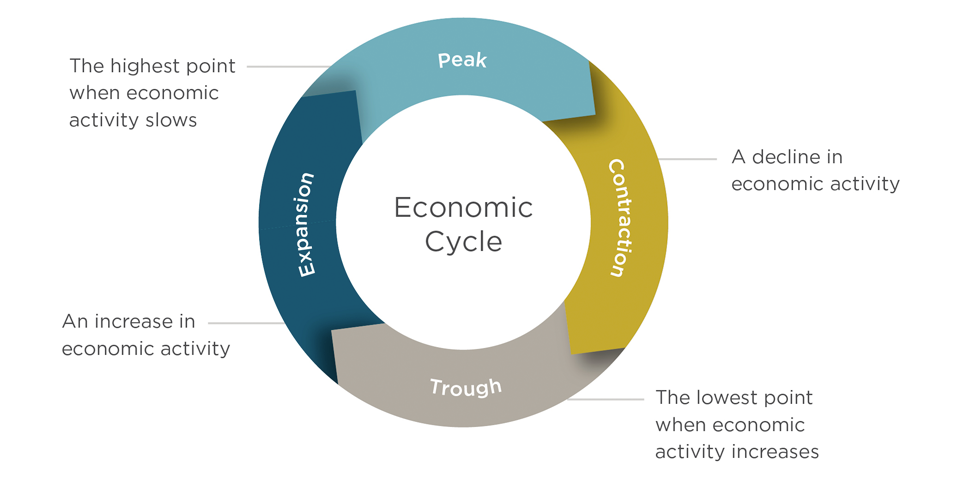
Navigate each phase of the market cycle
The SG Macro Compass Index (the “Index”) is the first index designed to identify changes in the economic cycle and rotate asset class allocations seeking to provide stable and consistent long term appreciation in up, down and sideways markets. It features:
- Access to key indicators determining the economic outlook
Changing growth and inflation expectations help identify potential changes in the market cycle - Shifting allocations through the market cycle
Based on the economic outlook for expanding, contracting or neutral markets, the Index may shift allocations of up to 13 underlying global assets in equities, bonds and commodities with the aim to generate returns - Quarterly updates seek to create stable long-term returns
The economic outlook is updated every three months seeking to provide consistent growth in changing markets
The index cannot be invested into directly. This web page does not describe the SG Macro Compass Index in its entirety. For additional information, please visit www.sg-macro-compass.com
Economic indicators determine strategic allocations
Since 1982, expected changes in economic growth and inflation have correctly predicted 11 of the last 15 major market corrections (when the S&P 500® Index declined by more than 10%). Every three months, the Index uses these indicators to shift asset class allocations to navigate future markets.
Growth and inflation expectation drive future outlook
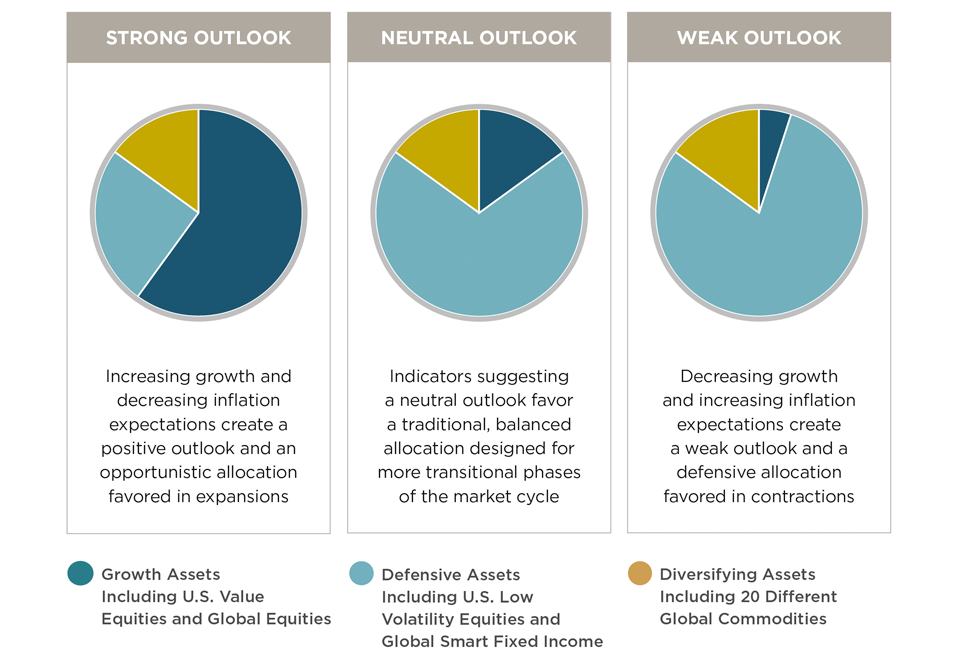
A risk control methodology makes daily adjustments between the strategic allocation and an interest-free cash account. This daily re-allocation is designed to help keep risk at bay.
Stable performance through the market cycle
The SG Macro Compass Index aims to provide steady growth through a variety of market environments. The graph below shows the volatility of the S&P 500® Price Index and how the SG Macro Compass Index would have provided steady hypothetical, backtested performance through over 20 years of up, down and sideways markets.
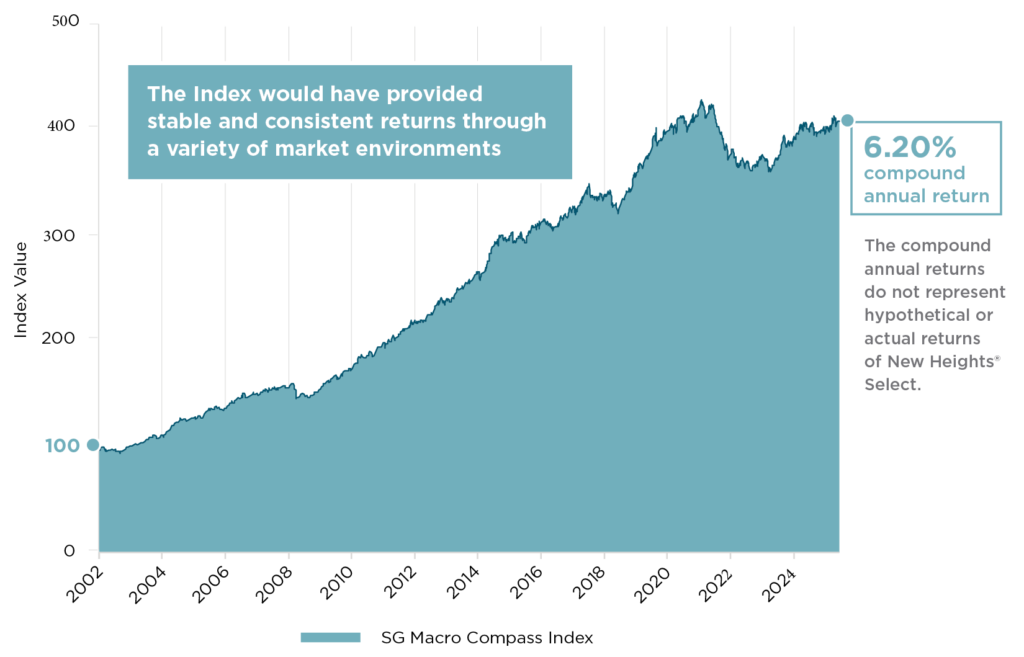
Source: Societe Generale from 7/15/02 to 12/31/25. All results are calculated for periods ending at the date above. The SG Macro Compass Index was launched on 8/28/20. Performance shown prior to 8/28/20 is back-tested by applying the Index strategy to historical financial data when all components were available and was designed with the benefit of hindsight. This back-tested, hypothetical, historical data has inherent limitations and is provided for illustrative purposes only. It should not be read as a guarantee or an indication of the future performance of the SG Macro Compass Index. Results during these periods may have been different (perhaps considerably) had the strategy actually been in existence. Unlike actual performance records, hypothetical or simulated performances, returns or scenarios may not necessarily reflect certain market factors such as liquidity constraints. Past performance is not indicative of nor does it guarantee future performance.
• Not a deposit • Not FDIC or NCUSIF insured • Not guaranteed by the institution • Not insured by any federal government agency • May lose value
This material is not a recommendation to buy or sell a financial product or to adopt an investment strategy. Investors should discuss their specific situation with their financial professional.
Nationwide New Heights Select is a single premium, fixed indexed deferred annuity issued by Nationwide Life and Annuity Insurance Company, Columbus, Ohio.
Guarantees and protections are subject to the claims-paying ability of Nationwide Life and Annuity Insurance Company.
Fixed annuities have limitations. They are long-term vehicles designed for retirement purposes. They are not intended to replace emergency funds, to be used as income for day-to-day expenses or to fund short-term savings goals. Please read the contract for complete details.
Withdrawals are subject to income tax, and withdrawals before age 59½ may be subject to a 10% federal tax penalty. New Heights Select does not directly participate in the stock market or any index. It is not possible to invest in an index. Neither Nationwide nor any of its affiliates are related to or affiliated with Societe Generale.
The SG Macro Compass Index (the “Index”) is the exclusive property of SG Americas Securities, LLC (SG Americas Securities, LLC, together with its affiliates, “SG”). SG has contracted with S&P Opco, LLC (a subsidiary of S&P Dow Jones Indices LLC (“S&P”) to maintain and calculate the Index. “SG Americas Securities, LLC”, “SGAS”, “Société Générale”, “SG”, “Société Générale Indices”, “SGI”, and “SG Macro Compass Index” (collectively, the “SG Marks”) are trademarks or service marks of SG. SG has licensed use of the SG Marks to Nationwide Life Insurance Company and Nationwide Life and Annuity Insurance Company (collectively, “Nationwide”) for use in certain life insurance and annuities offered by Nationwide (the “Products”). With respect to the Products, SG’s sole contractual relationship with Nationwide is to license the Index and the SG Marks to Nationwide. None of SG, S&P, or other third party licensor (collectively, the “Index Parties”) to SG is acting, or has been authorized to act, as an agent of Nationwide or has in any way sponsored, promoted, solicited, negotiated, endorsed, offered, sold, issued, supported, structured or priced any Products or provided investment advice to Nationwide.
No Index Party has passed on the legality or suitability of, or the accuracy or adequacy of the descriptions and disclosures relating to, the Products, including those disclosures with respect to the Index. The Index Parties make no representation whatsoever, whether express or implied, as to the advisability of purchasing, selling or holding any product linked to the Index, including the Products, or the ability of the Index to meet its stated objectives, including meeting its target volatility. The Index Parties have no obligation to, and will not, take the needs of Nationwide or any Product owner into consideration in determining, composing or calculating the Index. The selection of the Index as a crediting option under a Product does not obligate Nationwide or SG to invest life insurance premium or annuity premium payments in the components of the Index.
THE INDEX PARTIES MAKE NO REPRESENTATION OR WARRANTY WHATSOEVER, WHETHER EXPRESS OR IMPLIED, AND HEREBY EXPRESSLY DISCLAIM ALL WARRANTIES (INCLUDING, WITHOUT LIMITATION, THOSE OF MERCHANTABILITY OR FITNESS FOR A PARTICULAR PURPOSE OR USE), WITH RESPECT TO THE INDEX OR ANY DATA INCLUDED THEREIN OR RELATING THERETO, AND IN PARTICULAR DISCLAIM ANY GUARANTEE OR WARRANTY EITHER AS TO THE QUALITY, ACCURACY, TIMELINESS AND/OR COMPLETENESS OF THE INDEX OR ANY DATA INCLUDED THEREIN, THE RESULTS OBTAINED FROM THE USE OF THE INDEX AND/OR THE CALCULATION OR COMPOSITION OF THE INDEX, OR CALCULATIONS MADE WITH RESPECT TO ANY PRODUCT AT ANY PARTICULAR TIME ON ANY PARTICULAR DATE OR OTHERWISE. THE INDEX PARTIES SHALL NOT BE LIABLE (WHETHER IN NEGLIGENCE OR OTHERWISE) TO ANY PERSON FOR ANY ERROR OR OMISSION IN THE INDEX OR IN THE CALCULATION OF THE INDEX, AND THE INDEX PARTIES ARE UNDER NO OBLIGATION TO ADVISE ANY PERSON OF ANY ERROR THEREIN, OR FOR ANY INTERRUPTION IN THE CALCULATION OF THE INDEX. NO INDEX PARTY SHALL HAVE ANY LIABILITY TO ANY PARTY FOR ANY ACT OR FAILURE TO ACT BY THE INDEX PARTIES IN CONNECTION WITH THE DETERMINATION, ADJUSTMENT OR MAINTENANCE OF THE INDEX. WITHOUT LIMITING THE FOREGOING, IN NO EVENT SHALL AN INDEX PARTY HAVE ANY LIABILITY FOR ANY DIRECT DAMAGES, LOST PROFITS OR SPECIAL, INCIDENTAL, PUNITIVE, INDIRECT OR CONSEQUENTIAL DAMAGES, EVEN IF NOTIFIED OF THE POSSIBILITY OF SUCH DAMAGES.
No Index Party is a fiduciary or agent of any purchaser, seller or holder of a Product. None of SG, S&P, or any third party licensor shall have any liability with respect to the Products in which an interest crediting option is based is on the Index, nor for any loss relating to the Products, whether arising directly or indirectly from the use of the Index, its methodology, any SG Mark or otherwise. No Index Party has any obligation to make payments under the Products.
In calculating the performance of the Index, SG deducts fixed transaction and replication costs, each calculated and deducted on a daily basis. The transaction and replication costs cover, among other things, rebalancing and replication costs. The total amount of transaction and replication costs is not predictable and will depend on a number of factors, including the leverage of the Index, which may be as high as 200%, the performance of the indexes underlying the Index, market conditions and the changes in the macro regimes, among other factors. The transaction and replication costs, which are increased by the Index’s leverage, will reduce the potential positive change in the Index and increase the potential negative change in the Index. While the volatility control applied by the Index may result in less fluctuation in rates of return as compared to indices without volatility controls, it may also reduce the overall rate of return as compared to products not subject to volatility controls.
The “S&P 500®” and the “S&P 500 Average Daily Risk Control 10% USD Price Return Index” are products of S&P Dow Jones Indices LLC or its affiliates (“SPDJI”) and has been licensed for use by Nationwide Life and Annuity Insurance Company (“Nationwide”). S&P®, S&P 500®, US 500, The 500, iBoxx®, iTraxx® and CDX® are trademarks of S&P Global, Inc. or its affiliates (“S&P”); Dow Jones® is a registered trademark of Dow Jones Trademark Holdings LLC (“Dow Jones”); and these trademarks have been licensed for use by SPDJI and sublicensed for certain purposes by Nationwide. Nationwide New Heights® Select is not sponsored, endorsed, sold or promoted by SPDJI, Dow Jones, S&P, their respective affiliates and none of such parties make any representation regarding the advisability of investing in such product(s) nor do they have any liability for any errors, omissions, or interruptions of the S&P 500®.
The SG Macro Compass Index is an excess return index. Indexes calculated on an excess return basis include calculation elements that reduce index performance. Because of this, an excess return version of an index will have lower performance than a total return version of the same index would, especially in high interest rate environments. Some excess return indexes also deduct a notional charge(s) in calculating index performance. This deduction(s) will reduce the potential positive change in index performance and increase the potential negative change in the index performance.
Nationwide, the Nationwide N and Eagle, Nationwide is on your side, Nationwide New Heights and New Heights are service marks of the Nationwide Mutual Insurance Company. © 2026 Nationwide
FAM-1258AO.5
(02/26)