Goldman Sachs New Horizons Index
An opportunity for increased returns and diversification
Nationwide has licensed the Goldman Sachs New Horizons Index (the “Index”) for use in the Nationwide New Heights Select fixed indexed annuities.¹ Nationwide has combined industry-leading best practices and a commitment to putting people first with an Index built upon academic principles. The result is a solution that uses forward-looking indicators and a unique group of assets focused on resiliency throughout evolving markets.
Helpful resources
An opportunity for increased returns and diversification
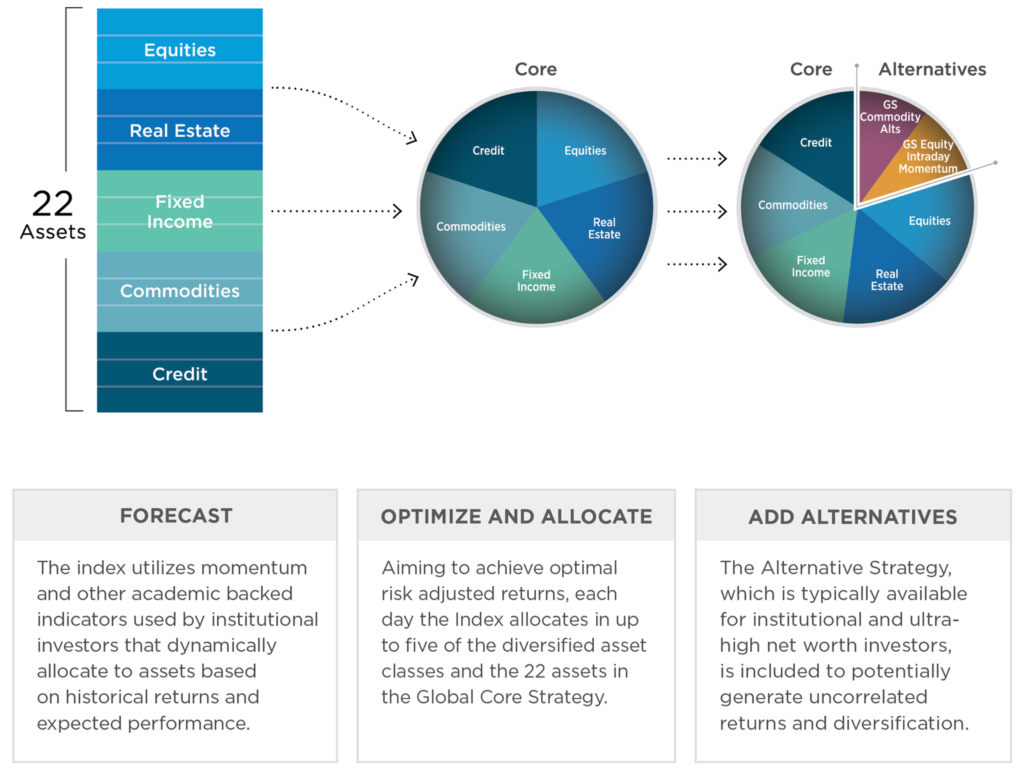
The Goldman Sachs New Horizons Index introduces the next frontier in terms of asset allocation—a Global Core Strategy and an Alternative Strategy—designed to potentially increase returns while improving diversification. The Index is guided by three key features:
Broad Diversification
The Global Core Strategy includes exposure to global equities, fixed income, commodities, credit and real estate for additional diversification and takes advantage of dynamic optimization.
Forward Looking
In addition to relying upon historical returns (“momentum”), the Index also incorporates forward looking indicators from institutional markets. It then uses this information to identify and systematically allocate to assets that are expected to perform well.
Alternative Allocations
The Index allocates to two alternative sub-strategies to diversify the exposure and potentially improve returns even during market downturns.
Access sophisticated, institutional-quality strategies
The broadly diversified Goldman Sachs New Horizons Index provides opportunities for growth through a Global Core Strategy and an Alternative Strategy. The Index features five asset classes and two alternatives that provide the flexibility to adapt to a variety of market environments and help contribute to the Index’s returns.
The Global Core Strategy
The Global Core Strategy is composed of 22 assets with exposure to five broadly diversified asset classes. These include equities across the US, Europe, Japan and Australia; bonds or other fixed-income investments across the US, Germany, Japan and Australia; commodities including gold, crude oil, copper and soybeans; credit that tracks investment grade and high yield corporate bonds in the US and Europe; and real estate in the US. The Strategy optimizes and allocates on a daily basis, aiming to smooth volatility and create more consistent returns.
The Alternative Strategy
Traditionally available for ultra-high net worth and institutional investors, the Alternative Strategy is composed of the GS Equity Intraday Momentum Strategy that monitors the US equity market and may rebalance every 30 minutes based on an intraday trend signal and the GS Commodity Alternative Strategy² that serves as an additional source of potential returns by exploring the potential opportunity that arises from the imbalance in trading by different commodities market participants.
An innovative approach backed by academic research
By allocating to both the Global Core Strategy and the Alternative Strategy, the Goldman Sachs New Horizons Index benefits from both traditional and alternative assets. The Global Core Strategy applies a Dynamic Optimization Process to potentially smooth volatility and create more consistent returns, while the Alternative Strategy provides an additional growth opportunity.
The Goldman Sachs New Horizons Index further rebalances daily to meet its 5% volatility control level. This daily re-allocation aims to further reduce risk when markets are volatile.
Dynamic rebalancing to potentially smooth returns
The Goldman Sachs New Horizons Index would have provided steady growth through a variety of market environments due to its Dynamic Optimization Process of the Global Core Strategy and the addition of Alternatives. It is important to note that the graph below shows the hypothetical performance of the Index using back tested data. Back-tested data is not indicative of future results.
Hypothetical Historical Performance of
Goldman Sachs New Horizons Index
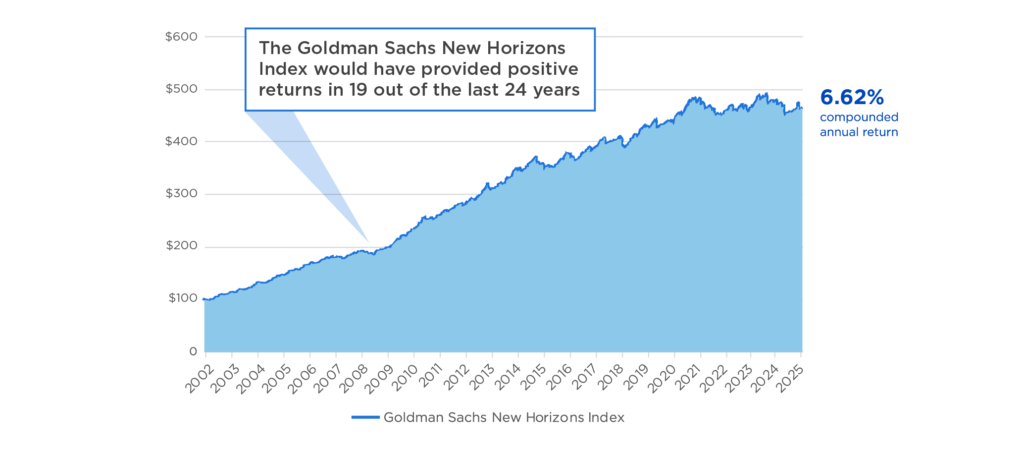
Source: Goldman Sachs from 1/4/2002 to 12/31/2025. The Goldman Sachs New Horizons Index was launched on 3/2/22. The back-tested, hypothetical, historical data before the launch date has inherent limitations and assumptions, and is provided for illustrative purposes only. It should not be read as a guarantee or an indication of the future performance of the Goldman Sachs New Horizons Index. Results during these periods may have been different (perhaps considerably) had the strategy actually been in existence. Unlike actual performance records, hypothetical or simulated performances, returns or scenarios may not necessarily reflect certain market factors such as liquidity constraints. Past performance is not indicative of nor does it guarantee future performance. The Goldman Sachs New Horizons Index performance information reflects a 0.50% per annum deduction rate along with servicing and rebalancing costs at rates that vary based on the underlying assets at the Index level and also within certain underlying assets. The deduction rate and costs will reduce the level of the Index. Future costs may vary and be higher or lower than historical costs.
• Not a deposit • Not FDIC or NCUSIF insured • Not guaranteed by the institution • Not insured by any federal government agency • May lose value
¹ Fixed indexed annuities are not an investment and do not directly invest in the stock market or any index.
² The full name of the strategy is GS Commodity Enhanced Carry Strategy.
This material is not a recommendation to buy or sell a financial product or to adopt an investment strategy. Investors should discuss their specific situation with their financial professional.
Nationwide New Heights Select is a single premium, fixed indexed deferred annuity issued by Nationwide Life and Annuity Insurance Company, Columbus, Ohio.
Guarantees and protections are subject to the claims-paying ability of Nationwide Life and Annuity Insurance Company.
Fixed annuities have limitations. They are long-term vehicles designed for retirement purposes. They are not intended to replace emergency funds, to be used as income for day-to-day expenses or to fund short-term savings goals. Please read the contract for complete details.
Withdrawals are subject to income tax, and withdrawals before age 59½ may be subject to a 10% federal tax penalty. New Heights Select does not directly participate in the stock market or any index. It is not possible to invest in an index. Neither Nationwide nor any of its affiliates are related to or affiliated with Goldman Sachs.
This product is not sponsored, endorsed, sold, guaranteed, underwritten, distributed or promoted by Goldman Sachs & Co. or any of its affiliates (including Goldman Sachs Asset Management, L.P.), with the exception of any endorsement, sales, distribution or promotion of this product that may occur through its affiliates that are licensed insurance agencies (excluding such affiliates, individually and collectively, “Goldman Sachs”) or its third party data providers. Goldman Sachs and its third party data providers make no representation or warranty, express or implied, regarding the advisability of investing in annuities generally, or in this product, or in the investment strategy underlying this product particularly, the ability of the Goldman Sachs New Horizons Index to perform as intended, the merit (if any) of obtaining exposure to the Goldman Sachs New Horizons Index or the suitability of purchasing or holding interests in this product. Goldman Sachs and its third party data providers do not have any obligation to take the needs of the holders of this product into consideration in determining, composing or calculating the Goldman Sachs New Horizons Index.
GOLDMAN SACHS DOES NOT GUARANTEE THE ACCURACY AND/OR COMPLETENESS OF THE GOLDMAN SACHS NEW HORIZONS INDEX OR OF THE METHODOLOGY UNDERLYING THE INDEX, THE CALCULATION OF THE INDEX OR ANY DATA SUPPLIED BY IT FOR USE IN CONNECTION WITH THIS PRODUCT. GOLDMAN SACHS EXPRESSLY DISCLAIMS ALL LIABILITY FOR ANY SPECIAL, PUNITIVE, INDIRECT OR CONSEQUENTIAL DAMAGE EVEN IF NOTIFIED OF THE POSSIBILITY OF SUCH DAMAGES. THIRD PARTY DATA IS USED UNDER LICENSE AS A SOURCE OF INFORMATION FOR THE GOLDMAN SACHS NEW HORIZONS INDEX. THIRD PARTY PROVIDER HAS NO OTHER CONNECTION TO GOLDMAN SACHS INDEXES AND SERVICES AND DOES NOT SPONSOR, ENDORSE, RECOMMEND OR PROMOTE ANY GOLDMAN SACHS INDEX OR SERVICES. THIRD PARTY PROVIDER HAS NO OBLIGATION OR LIABILITY IN CONNECTION WITH THE GOLDMAN SACHS INDEX AND SERVICES. THIRD PARTY PROVIDER DOES NOT GUARANTEE THE ACCURACY AND/OR THE COMPLETENESS OF ANY MARKET DATA LICENSED TO GOLDMAN SACHS AND SHALL NOT HAVE ANY LIABILITY FOR ANY ERRORS, OMISSIONS, OR INTERRUPTIONS THEREIN. THERE ARE NO THIRD-PARTY BENEFICIARIES OF ANY AGREEMENTS OR ARRANGEMENTS BETWEEN THIRD PARTY PROVIDER AND GOLDMAN SACHS.
‘Goldman Sachs,’ ‘Goldman,’ ‘Goldman Sachs New Horizons Index’ are trademarks or service marks of Goldman Sachs & Co. and have been licensed for use by Nationwide Life and Annuity Insurance Company for use in connection with this product.
The Goldman Sachs New Horizons Index performance information reflects a 0.50% per annum deduction rate, and servicing (based on notional positions) and rebalancing (based on turnover) costs at rates that vary based on the underlying assets at the Goldman Sachs New Horizons Index level and also within certain underlying assets, but there may be additional fees and costs that are separately applied to this product. Because certain costs are based on both turnover and a market-based rate, such costs are not predictable and may increase substantially in the future, especially during periods of market stress. Further, the deduction rate and costs will reduce the potential positive change in the Goldman Sachs New Horizons Index performance and increase the potential negative change in the Goldman Sachs New Horizons Index performance.
The Goldman Sachs New Horizons Index is an excess return index. Indexes calculated on an excess return basis include calculation elements that reduce index performance. Because of this, an excess return version of an index will have lower performance than a total return version of the same index would, especially in high interest rate environments. Some excess return indexes also deduct a notional charge(s) in calculating index performance. This deduction(s) will reduce the potential positive change in index performance and increase the potential negative change in the index performance.
Nationwide, the Nationwide N and Eagle, Nationwide is on your side, Nationwide New Heights and New Heights are service marks of the Nationwide Mutual Insurance Company. © 2026 Nationwide
FAM-1461AO.5
(02/26)